Ephesians
Charts and companion articles on the structure and message of Paul's letter.

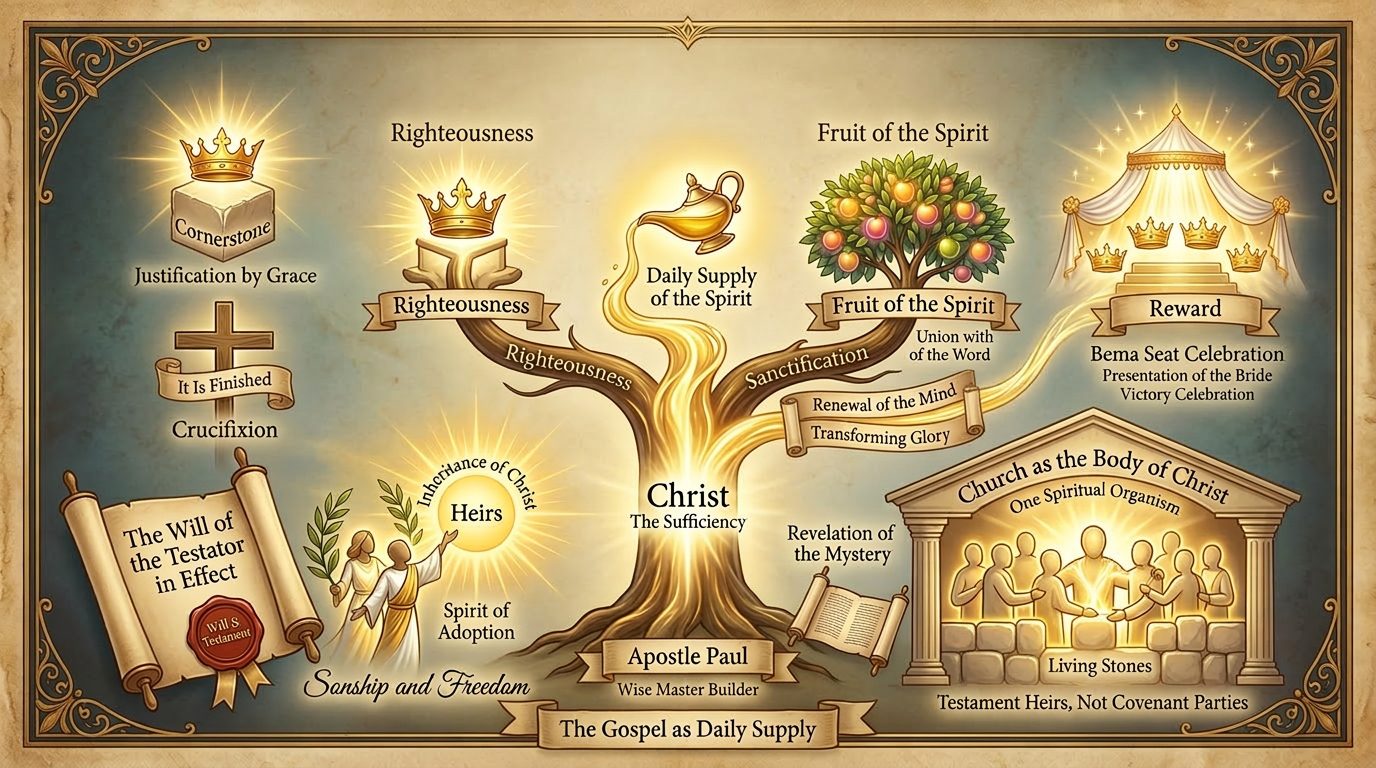
The Visual Theology charts are designed to help you see the structure and movement of Scripture. They highlight patterns, contrasts, and developments that are often difficult to hold together when reading line by line.
These charts show the structure of the argument. The accompanying articles develop each part in full.
This approach follows a long tradition of visual teaching in the Church. The well-known charts of Clarence Larkin helped many grasp the broad outline of Scripture. In the same spirit, these charts aim to make visible what the Word of God is revealing.
Charts and companion articles on the structure and message of Paul's letter.
Charts and companion articles on Galatians—law, faith, and life in the Spirit.

Charts from The Master Key: Daniel's 70th Week—the prophetic framework and gospel purity.

Charts from Grace to Glory—the Rapture, the Bema, and what happens next.

Charts from Genesis 15 to the New Jerusalem on the covenant, testament, priesthood, and inheritance in Christ.

Chart studies of the letter to the Hebrews—coming soon.
Explore ChartsVisual theology of Romans—coming soon.
Explore ChartsEvery chart in this library is free, and it's going to stay that way. But while these are hosted freely, they are not free to make. A chart series might start at $15–20 in production costs, but by the time I've curated the output, reworked the logic, regenerated images that didn't land, and rewritten the companion articles — sometimes multiple times — a single series can run $60–100 in API costs alone, plus weeks of full-time work. The pipeline I've built that allows me to do things like this at scale is amazing, expensive to run, and rarely gets it right on the first pass. Most of these charts have been through dozens of iterations to get the theology and the visuals to say the same thing.
There's a long list of topics I want to build next — the everlasting covenant, our death with Christ, Christ as our reward, the mystery of the one body — material that's hard to access and harder to visualize. The kind of thing people hear taught once and say "I wish I could see that laid out."
That's what this project does. And if you've been helped by what's here, you can be part of what comes next.
Every chart in the Visual Theology library is free to explore online. Membership supports this ministry and unlocks the rest of the tools on this portal—Eliezer, audiobooks, study Bible, and more. Learn about membership.